3.2. PC_ENRICH: Enrichment visualization
For a small genome (e.g., yeast), the sequencing depth is generally enough (> 10-fold). In such cases, the genome-wide ChIP/Input enrichment distribution is informative because the technical and biological bias in high throughput sequencing can be minimized.
Here, we show an example according to the sample script sample.yeast.sh, which can be found in the “tutorial” directory.
3.2.1. Downloading data
Here, we use the data of replication analysis (Repli-seq) for S. cerevisiae, which can be treated in the same manner as ChIP-seq. The original paper is: Origin Association of Sld3, Sld7, and Cdc45 Proteins Is a Key Step for Determination of Origin-Firing Timing
The CRAM-format map files can be downloaded from our Google Drive account:
3.2.2. Parse2wig
The command below generates a bigWig data for the six CRAM files:
gt=../data/genometable/genometable.sacCer3.txt
mptable=../data/mptable/mptable.UCSC.sacCer3.50mer.flen150.txt
for cell in YST1019_Gal YST1019_Raf YST1053_Gal; do
   for min in 0min 60min; do
       cram=${cell}_${min}-n2-k1.sort.cram
       parse2wig+ -i $cram  -o ${cell}_${min} --gt $gt --mptable $mptable -n GR
   done
done
3.2.3. Generating the enrichment distribution
To generate a PDF file of the enrichment distribution for S. cerevisiae with the gene annotation, type:
$ dir=parse2wigdir+
$ gene=../data/S_cerevisiae/SGD_features.tab
$ drompa+ PC_ENRICH \
      -i $dir/YST1019_Gal_60min.100.bw,$dir/YST1019_Gal_0min.100.bw,YST1019_Gal,,,200 \
      -i $dir/YST1019_Raf_60min.100.bw,$dir/YST1019_Raf_0min.100.bw,YST1019_Raf,,,200 \
      -i $dir/YST1053_Gal_60min.100.bw,$dir/YST1053_Gal_0min.100.bw,YST1053_Gal,,,200 \
      -o drompa-yeast --gt $gt -g $gene --gftype 2 \
      --scale_ratio 1 --ls 200 --sm 10 --lpp 3
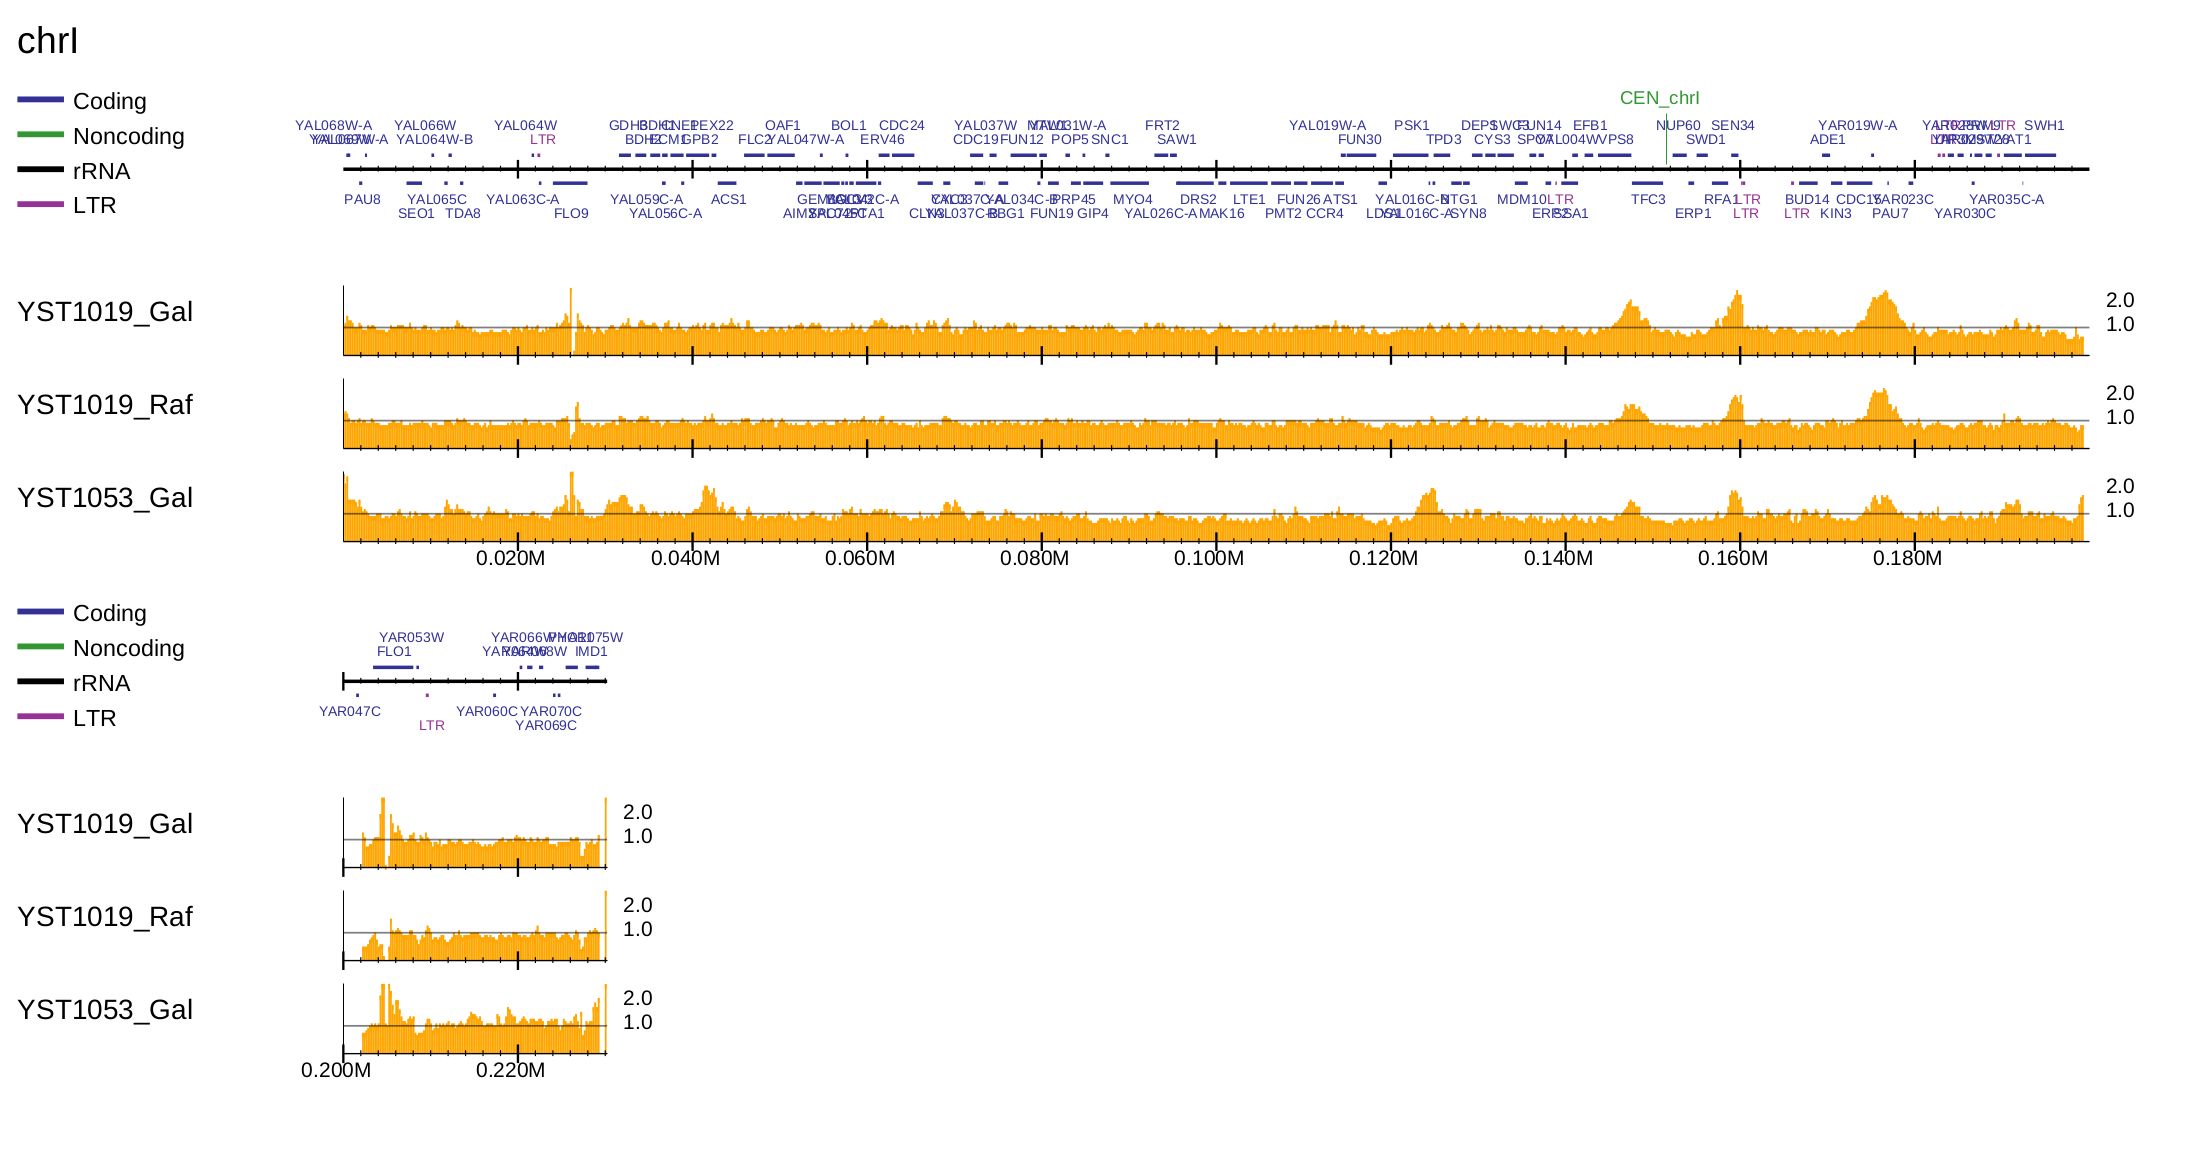
Fig. 3.10 Generation of the enrichment distribution of S. cerevisiae.
Supply the --ars option to visualize the DNA replication origin (ARS) available for S. cerevisiae and S. pombe.
The annotation data can be obtained from OriDB.:
$ dir=parse2wigdir+
$ ars=../data/S_cerevisiae/ARS-oriDB_scer.txt
$ drompa+ PC_ENRICH \
      -i $dir/YST1019_Gal_60min.100.bw,$dir/YST1019_Gal_0min.100.bw,YST1019_Gal,,,200 \
      -i $dir/YST1019_Raf_60min.100.bw,$dir/YST1019_Raf_0min.100.bw,YST1019_Raf,,,200 \
      -i $dir/YST1053_Gal_60min.100.bw,$dir/YST1053_Gal_0min.100.bw,YST1053_Gal,,,200 \
      -o drompa-yeast-ARS --gt $gt --ars $ars \
      --scale_ratio 1 --ls 200 --sm 10 --lpp 3
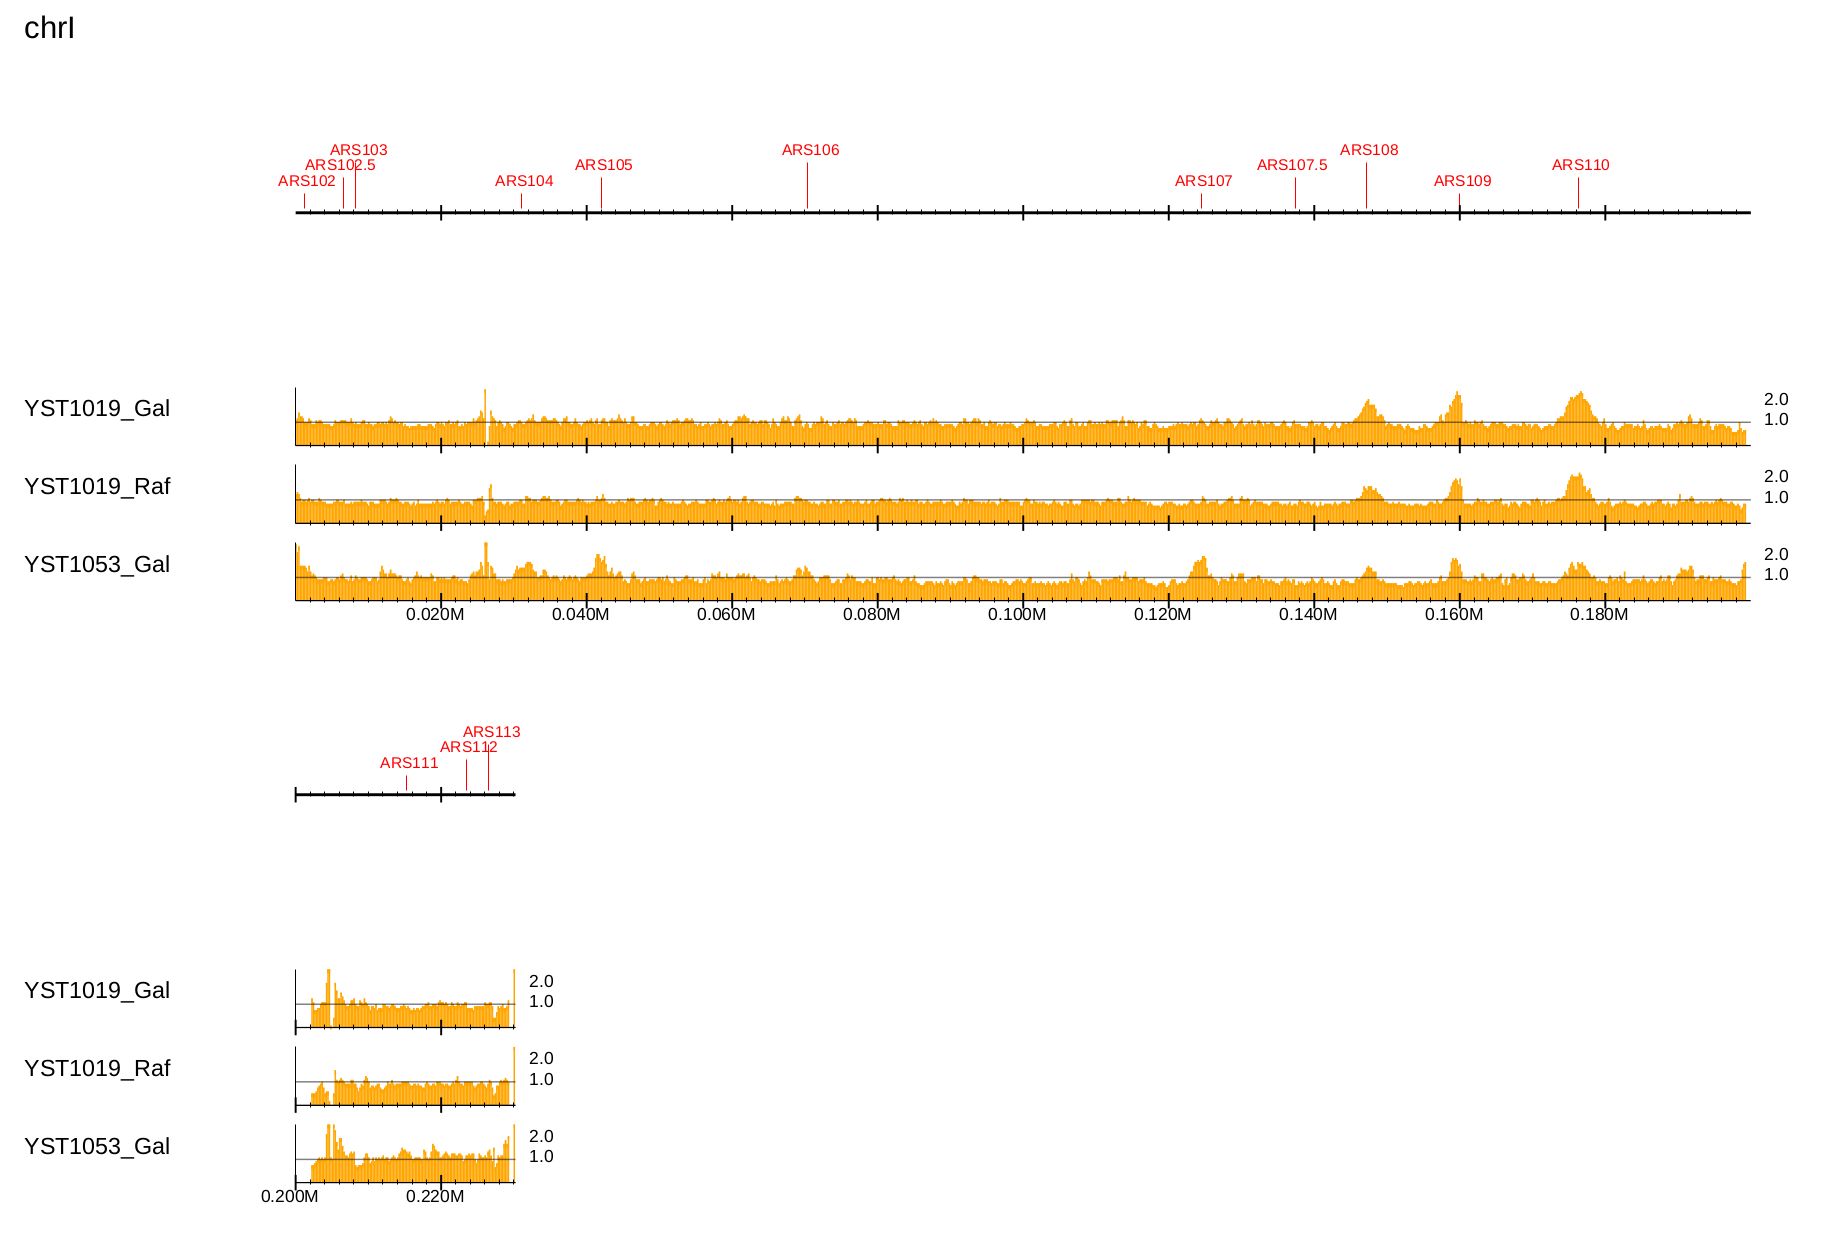
Fig. 3.11 Visualization of the DNA replication origin available for S. cerevisiae.
To check the enrichment level accurately, specify the number of y-axis memories and y-axis height using the --bn and --ystep options, respectively:
$ dir=parse2wigdir+
$ ars=../data/S_cerevisiae/ARS-oriDB_scer.txt
$ drompa+ PC_ENRICH \
      -i $dir/YST1019_Gal_60min.100.bw,$dir/YST1019_Gal_0min.100.bw,YST1019_Gal,,,200 \
      -i $dir/YST1019_Raf_60min.100.bw,$dir/YST1019_Raf_0min.100.bw,YST1019_Raf,,,200 \
      -i $dir/YST1053_Gal_60min.100.bw,$dir/YST1053_Gal_0min.100.bw,YST1053_Gal,,,200 \
      -o drompa-yeast-detail --gt $gt --ars $ars \
      --scale_ratio 1 --ls 200 --sm 10 --lpp 3 \
      --bn 5 --ystep 10
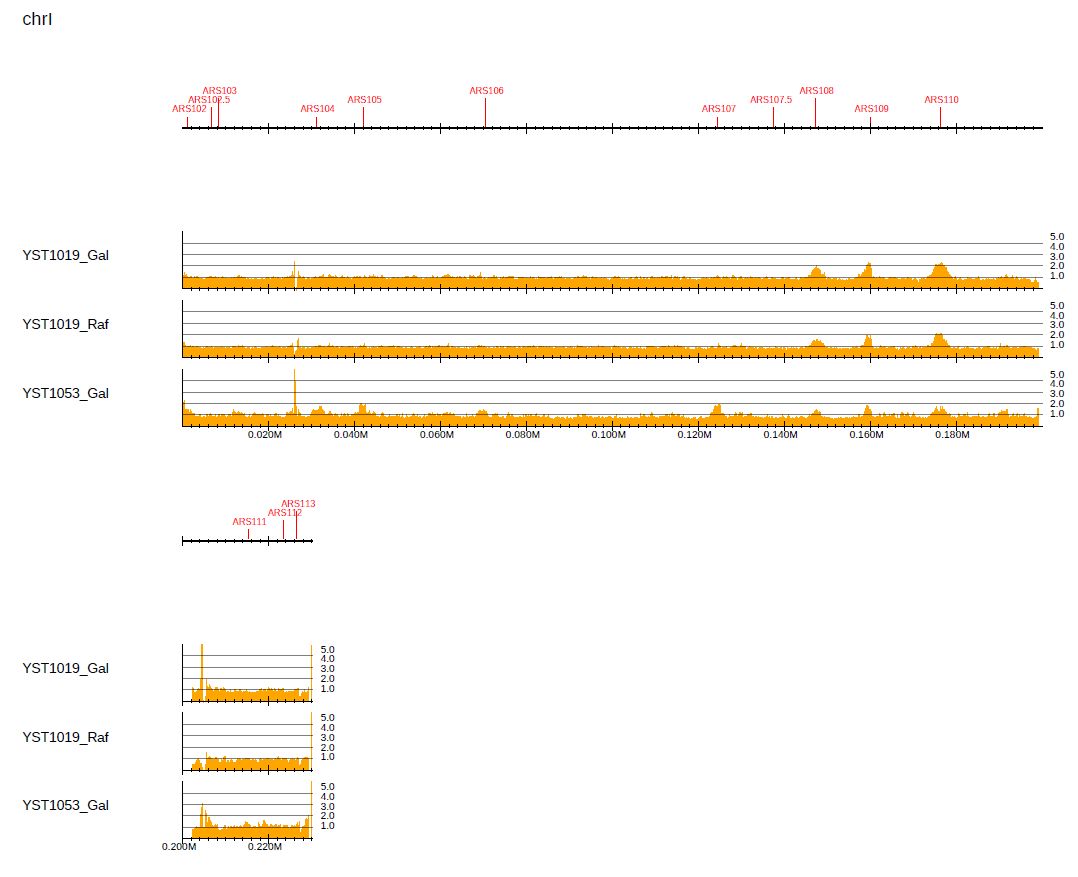
Fig. 3.12 Checking the enrichment level by specifying the number of y-axis memories and y-axis height.
3.2.4. Highlight peaks
With the --callpeak option, PC_ENRICH mode highlights in red the bins containing ChIP/Input enrichments above the enrichment threshold (2.0 by default):
$ dir=parse2wigdir+
$ ars=../data/S_cerevisiae/ARS-oriDB_scer.txt
$ drompa+ PC_ENRICH \
      -i $dir/YST1019_Gal_60min.100.bw,$dir/YST1019_Gal_0min.100.bw,YST1019_Gal,,,200 \
      -i $dir/YST1019_Raf_60min.100.bw,$dir/YST1019_Raf_0min.100.bw,YST1019_Raf,,,200 \
      -i $dir/YST1053_Gal_60min.100.bw,$dir/YST1053_Gal_0min.100.bw,YST1053_Gal,,,200 \
      --callpeak \
      -o drompa-yeast-ARS-peak1 --gt $gt --ars $ars \
      --scale_ratio 1 --ls 200 --sm 10 --lpp 3
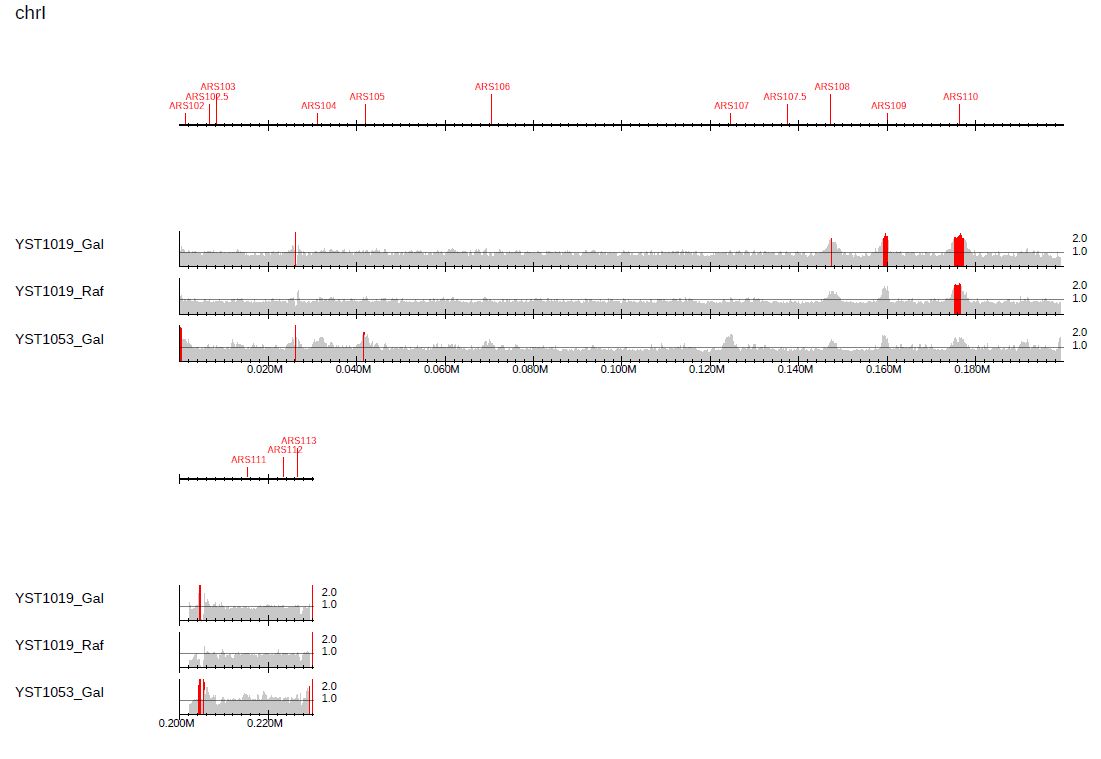
Fig. 3.13 Highlighting peaks for the default enrichment threshold.
In Fig. 3.12, the difference of replicated regions between the samples is more pronounced.
To change the enrichment threshold, supply --ethre as follows:
$ dir=parse2wigdir+
$ ars=../data/S_cerevisiae/ARS-oriDB_scer.txt
$ drompa+ PC_ENRICH \
      -i $dir/YST1019_Gal_60min.100.bw,$dir/YST1019_Gal_0min.100.bw,YST1019_Gal,,,200 \
      -i $dir/YST1019_Raf_60min.100.bw,$dir/YST1019_Raf_0min.100.bw,YST1019_Raf,,,200 \
      -i $dir/YST1053_Gal_60min.100.bw,$dir/YST1053_Gal_0min.100.bw,YST1053_Gal,,,200 \
      --callpeak --ethre 1.5 \
      -o drompa-yeast-ARS-peak2 --gt $gt --ars $ars \
      --scale_ratio 1 --ls 200 --sm 10 --lpp 3
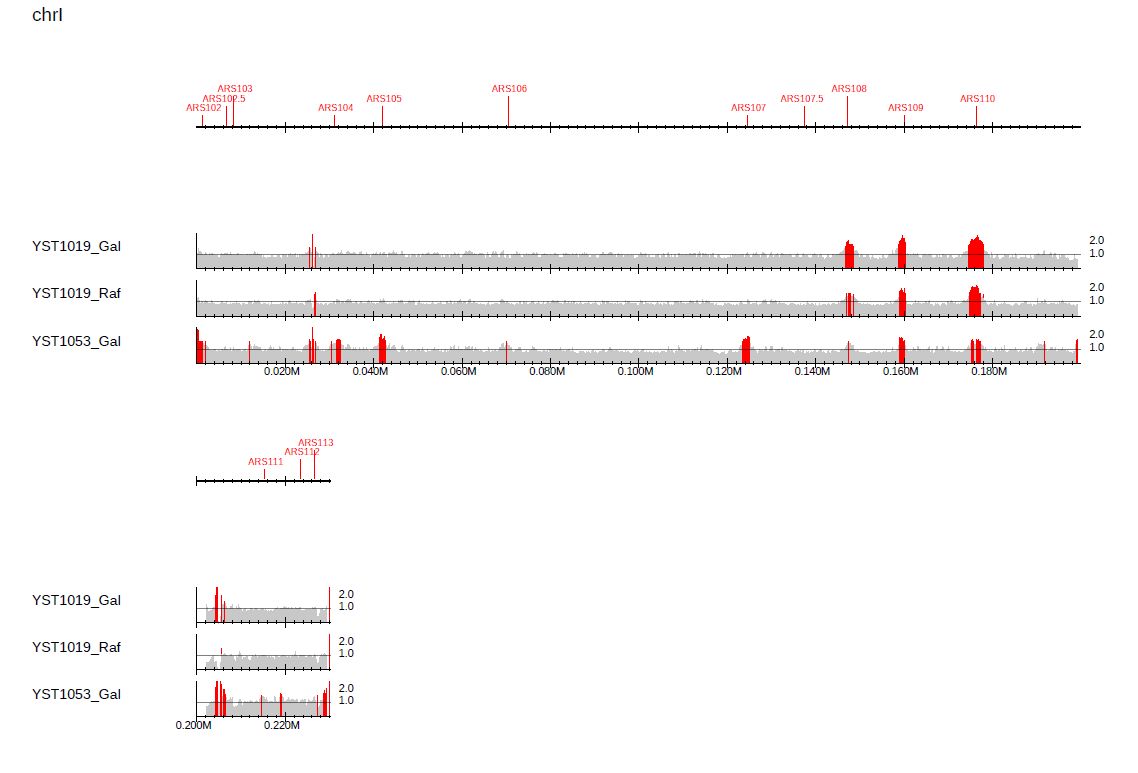
Fig. 3.14 Highlighting peaks for a specified enrichment threshold.
3.2.5. Log-ratio distribution
Log-scaled ChIP/Input enrichment can be visualized by supplying --showratio 2:
$ dir=parse2wigdir+
$ ars=../data/S_cerevisiae/ARS-oriDB_scer.txt
$ drompa+ PC_ENRICH \
      -i $dir/YST1019_Gal_60min.100.bw,$dir/YST1019_Gal_0min.100.bw,YST1019_Gal,,,200 \
      -i $dir/YST1019_Raf_60min.100.bw,$dir/YST1019_Raf_0min.100.bw,YST1019_Raf,,,200 \
      -i $dir/YST1053_Gal_60min.100.bw,$dir/YST1053_Gal_0min.100.bw,YST1053_Gal,,,200 \
      -o drompa-yeast-log2ratio \
      --gt $gt --ars $ars \
      --showratio 2 --scale_ratio 2 \
      --ls 200 --sm 10 --bn 4 --lpp 3 \
      --chr I
where --chr I is supplied to generate the PDF file for chrI only. --bn 4 is supplied to increase the number of y-axis memories.
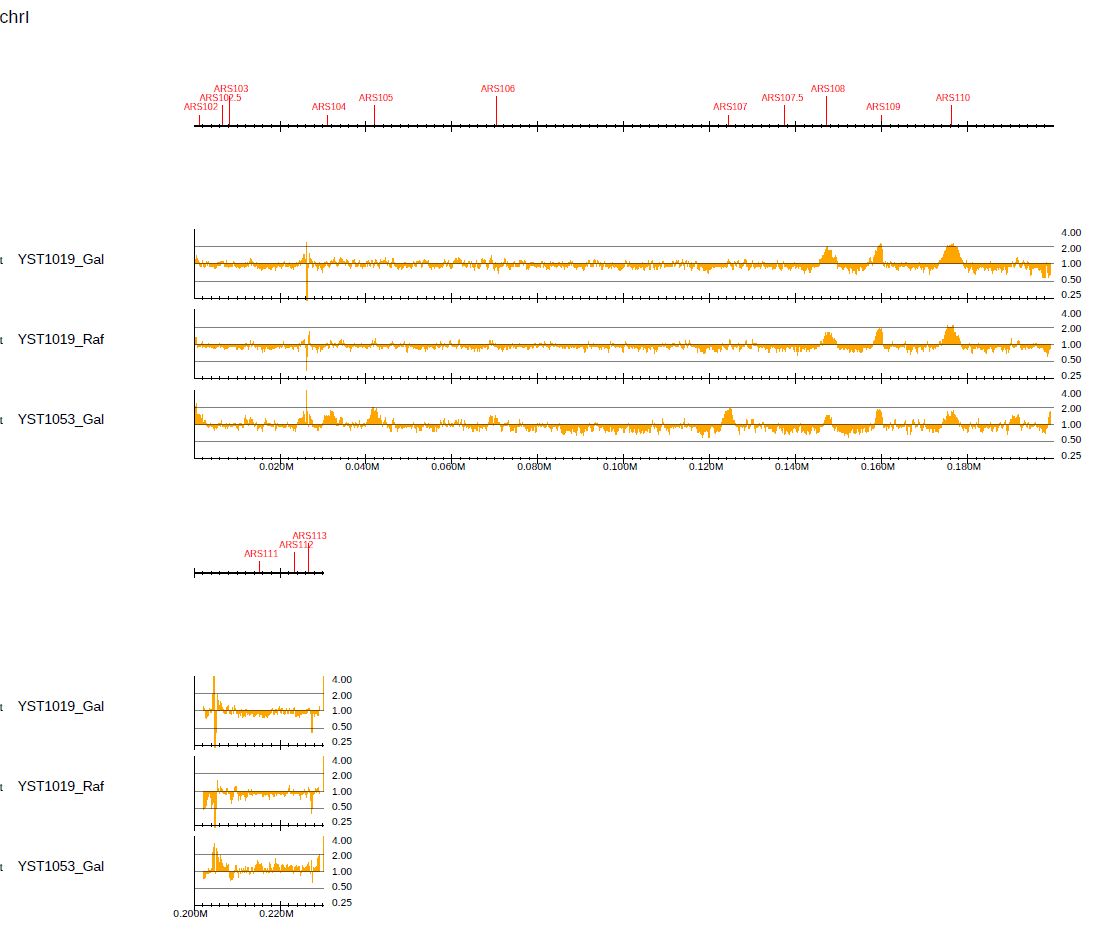
Fig. 3.15 Visualization of log-scaled enrichment.
In this mode, --scale_ratio indicates the base of the logarithm. To use log10, specify --scale_ratio 10:
$ dir=parse2wigdir+
$ ars=../data/S_cerevisiae/ARS-oriDB_scer.txt
$ drompa+ PC_ENRICH \
      -i $dir/YST1019_Gal_60min.100.bw,$dir/YST1019_Gal_0min.100.bw,YST1019_Gal,,,200 \
      -i $dir/YST1019_Raf_60min.100.bw,$dir/YST1019_Raf_0min.100.bw,YST1019_Raf,,,200 \
      -i $dir/YST1053_Gal_60min.100.bw,$dir/YST1053_Gal_0min.100.bw,YST1053_Gal,,,200 \
      -o drompa-yeast-log10ratio \
      --gt $gt --ars $ars \
      --showratio 2 --scale_ratio 10 \
      --ls 200 --sm 10 --bn 4 --lpp 3 \
      --chr I
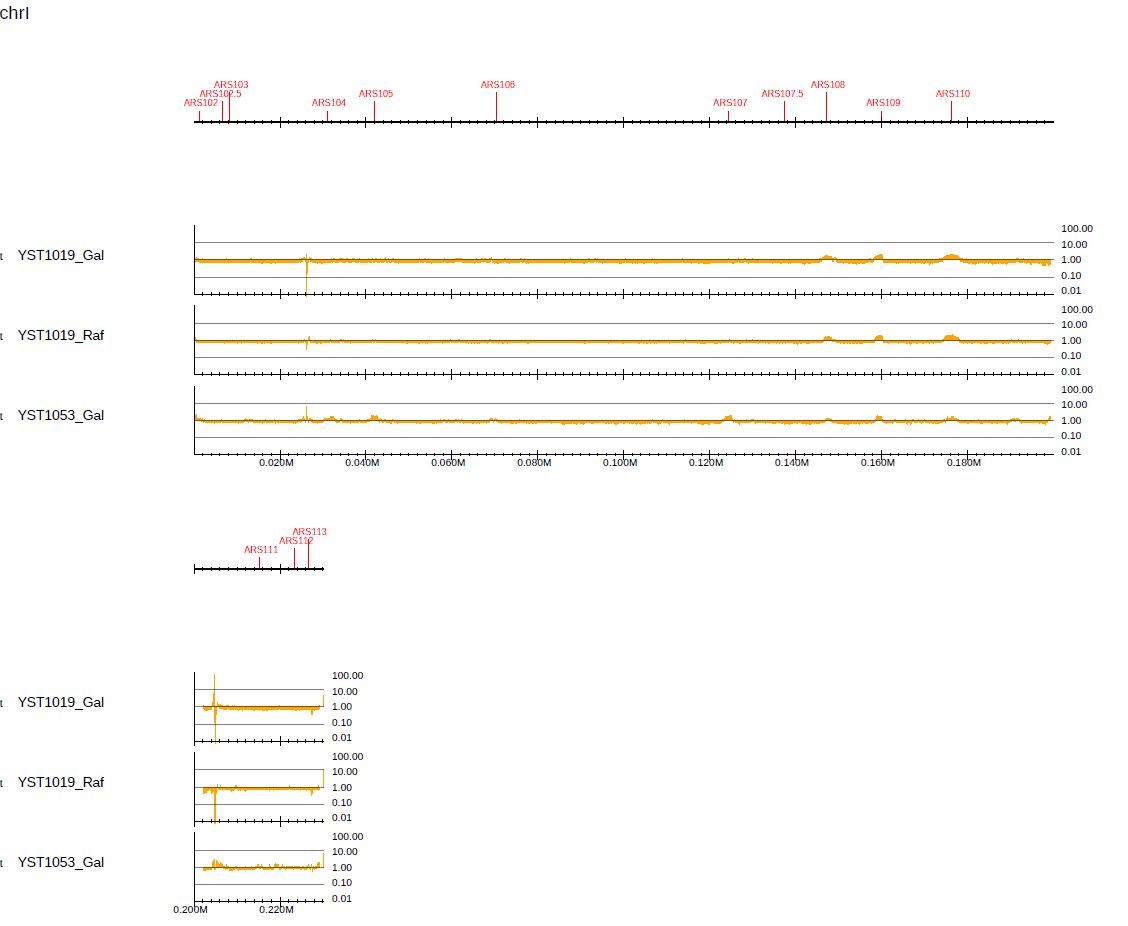
Fig. 3.16 Visualization of log-scaled enrichment for log10.
Use the --callpeak option to change colors between >1 and <1:
$ dir=parse2wigdir+
$ ars=../data/S_cerevisiae/ARS-oriDB_scer.txt
$ drompa+ PC_ENRICH \
      -i $dir/YST1019_Gal_60min.100.bw,$dir/YST1019_Gal_0min.100.bw,YST1019_Gal,,,200 \
      -i $dir/YST1019_Raf_60min.100.bw,$dir/YST1019_Raf_0min.100.bw,YST1019_Raf,,,200 \
      -i $dir/YST1053_Gal_60min.100.bw,$dir/YST1053_Gal_0min.100.bw,YST1053_Gal,,,200 \
      -o drompa-yeast-log2ratio2 \
      --gt $gt --ars $ars \
      --showratio 2 --scale_ratio 2 \
      --ls 200 --sm 10 --bn 4 --lpp 3 \
      --callpeak \
      --chr I
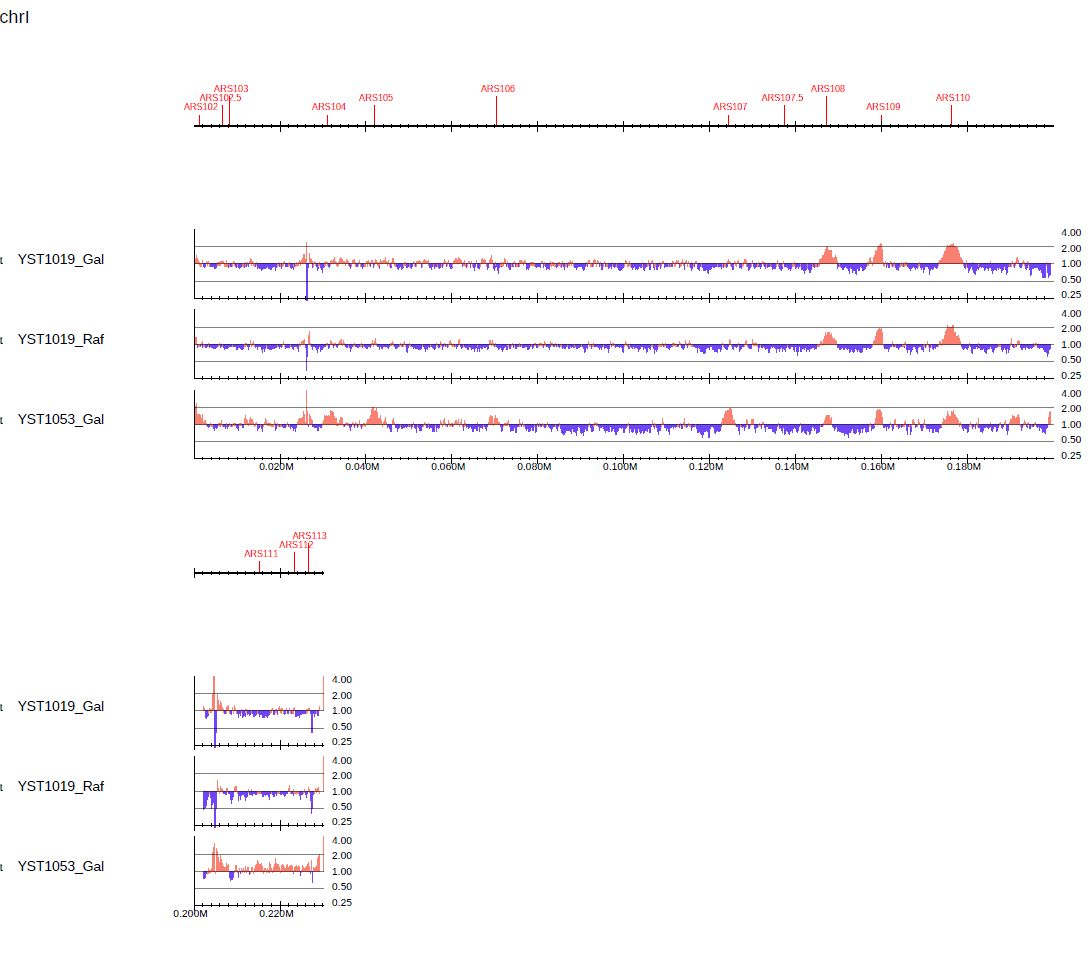
Fig. 3.17 Visualization of log-scaled enrichment using the --callpeak option.