3.6. HEATMAP (using Python3)
The TSV files generated by PROFILE command describe the mapped read number of each site. This data can also be used for heatmap analysis.
DROMAplus has a Python3 script, drompa.heatmap.py in the “otherbins” directory that generates a heatmap PNG file from the TSV files. This script requires the pandas, matplotlib and seaborn libraries.
The following command:
drompa.heatmap.py \
   -o heatmap-aroundTSS \
   profile-K562-aroundTSS.ChIPread.H3K4me3.tsv \
   profile-K562-aroundTSS.ChIPread.H3K27me3.tsv \
   profile-K562-aroundTSS.ChIPread.H3K36me3.tsv
generates the PNG shown in Fig. 3.25.
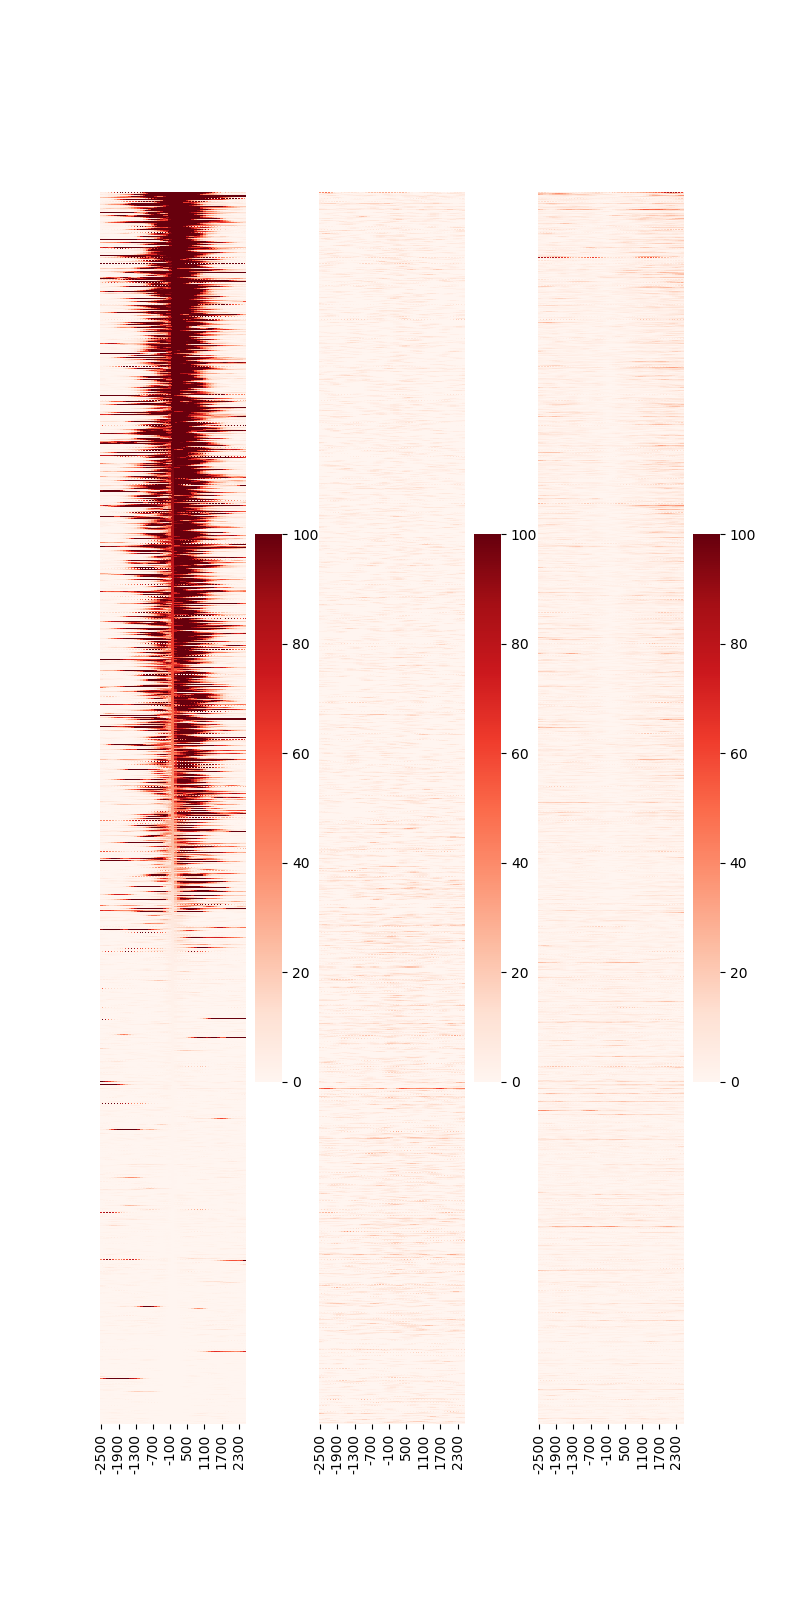
Fig. 3.25 Heatmap around TSS.
The rows are sorted by the center position (“0” on the x-axis) of the 1st sample. Specify --sortid to change the sample to be sorted.
Additionally, specify --notsort if sorting is not necessary.
The --vmax option can be used to change the color scale of the heatmap.
The following command:
drompa.heatmap.py \
   -o heatmap-aroundGene \
   profile-K562-aroundGene.ChIPread.H3K4me3.tsv \
   profile-K562-aroundGene.ChIPread.H3K27me3.tsv \
   profile-K562-aroundGene.ChIPread.H3K36me3.tsv
generates the PNG file shown in Fig. 3.26.
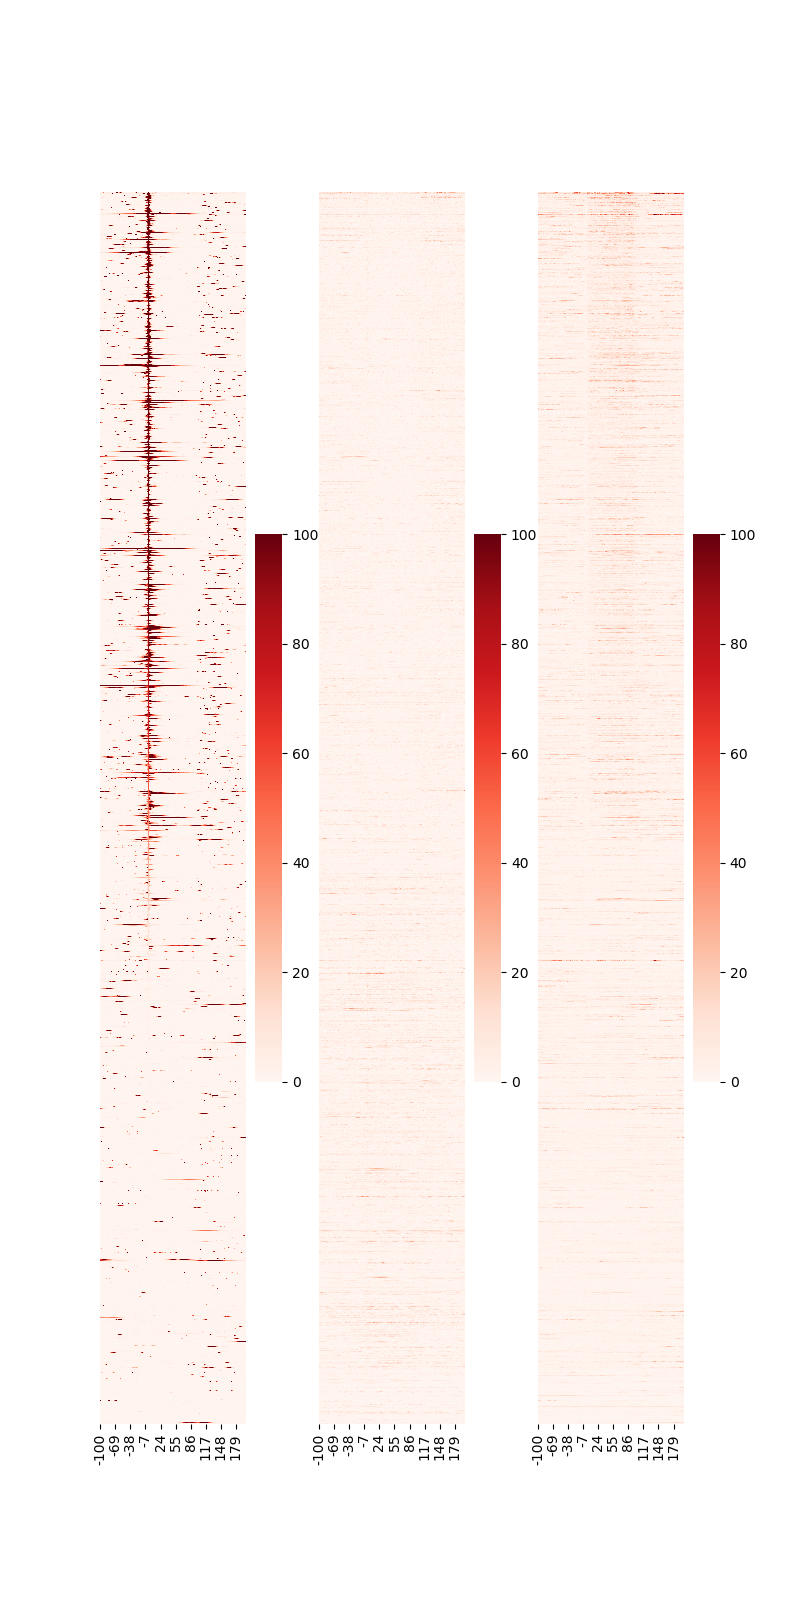
Fig. 3.26 Heatmap around gene.