3.5. PROFILE: Aggregation plot (using R)
The PROFILE mode makes an aggregation plot by supplying:
--ptype 0: around transcription start sites (TSS)--ptype 1: around transcription termination sites (TTS)--ptype 2: divide genes into 100 subregions--ptype 3: around peaks
In PROFILE mode, short genes (< 1kbp) are ignored.
The following command outputs an averaged profile of ChIP reads around TSSs:
dir=parse2wigdir+
drompa+ PROFILE --ptype 0 \
   -i $dir/H3K4me3.100.bw,$dir/Input.100.bw,H3K4me3 \
   -i $dir/H3K27me3.100.bw,$dir/Input.100.bw,H3K27me3 \
   -i $dir/H3K36me3.100.bw,$dir/Input.100.bw,H3K36me3 \
   -o aroundtss -g refFlat.txt --gt genometable.txt
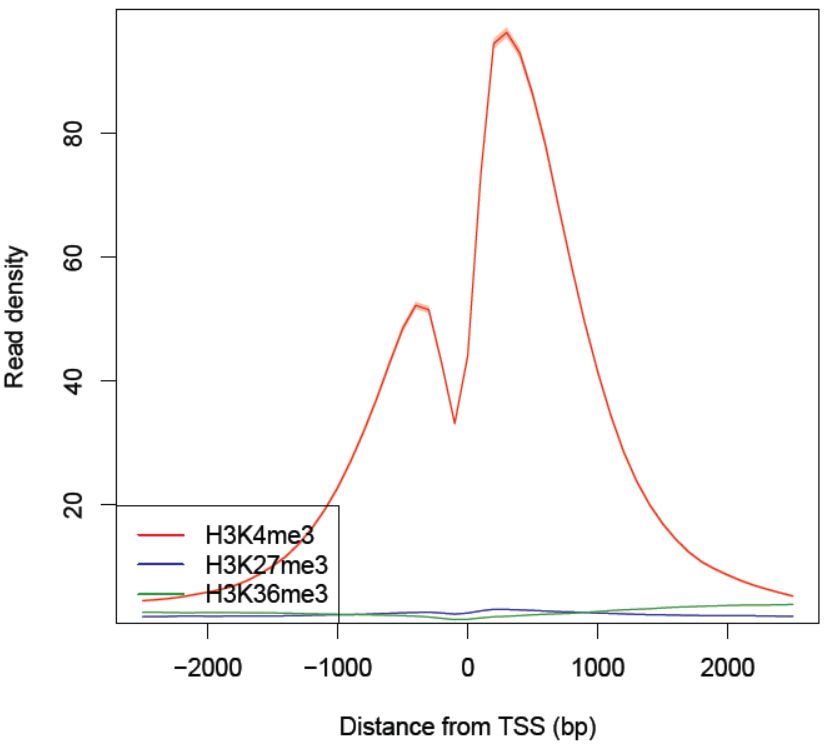
Fig. 3.22 The read density as a function of the distance from the TSS.
The output files are as follows:
a PDF file (aroundTSS.PROFILE.averaged.ChIPread.pdf)
a corresponding .tsv file for each samples (here aroundTSS.PROFILE.averaged.ChIPread.H3K27me3.tsv, aroundTSS.PROFILE.averaged.ChIPread.H3K36me3.tsv and aroundTSS.PROFILE.averaged.ChIPread.H3K4me3.tsv)
a R script to generate the PDF file using .tsv files (aroundTSS.PROFILE.averaged.ChIPread.R)
Similarly, the --ptype 1 option generates an averaged profile around TESs.
The --ptype 2 option generates the averaged profile arouond whole gene bodies (gene length is normalized):
dir=parse2wigdir+
drompa+ PROFILE --ptype 2 \
   -i $dir/H3K4me3.100.bw,$dir/Input.100.bw,H3K4me3 \
   -i $dir/H3K27me3.100.bw,$dir/Input.100.bw,H3K27me3 \
   -i $dir/H3K36me3.100.bw,$dir/Input.100.bw,H3K36me3 \
   -o aroundgene -g refFlat.txt --gt genometable.txt
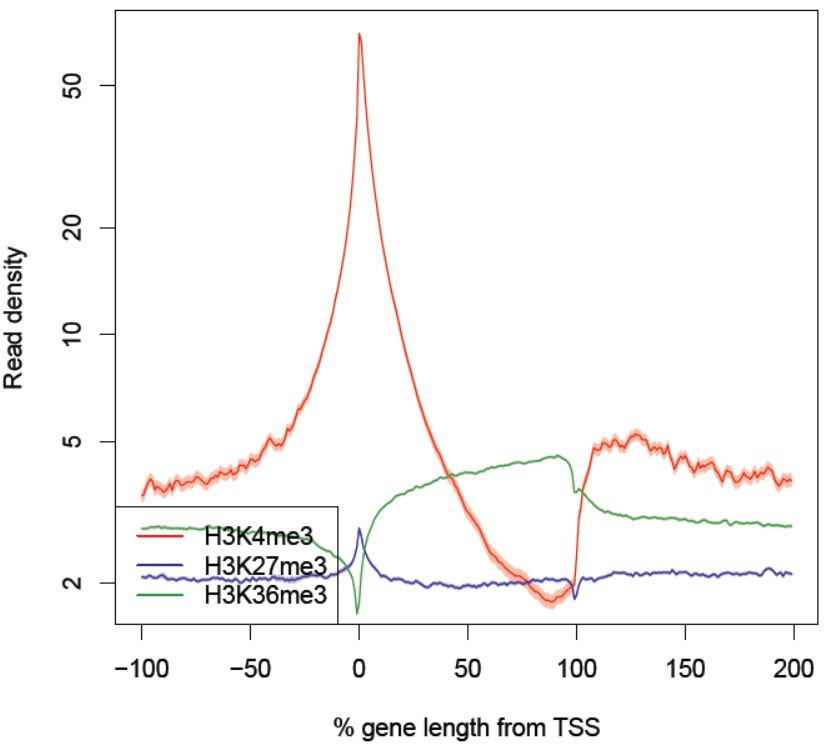
Fig. 3.23 The read density as a function of the percentage of the gene length from the TSS.
The shaded regions indicate the 95% confidence interval.
3.5.1. Averaged profile of ChIP/Input enrichment
Using the --stype 1 option, drompa+ plots an averaged profile of ChIP/Input enrichment.
It is noted that this is “an average of enrichment for all sites”, not “an enrichment between the averaged ChIP reads and Input reads for all sites.”:
dir=parse2wigdir+
drompa+ PROFILE --ptype 2 --stype 1 \
   -i $dir/H3K4me3.100.bw,$dir/Input.100.bw,H3K4me3 \
   -i $dir/H3K27me3.100.bw,$dir/Input.100.bw,H3K27me3 \
   -i $dir/H3K36me3.100.bw,$dir/Input.100.bw,H3K36me3 \
   -o aroundgene.enrich -g refFlat.txt --gt genometable.txt
The output PDF file is named “profile-aroundGene.PROFILE.averaged.Enrichment.pdf.”
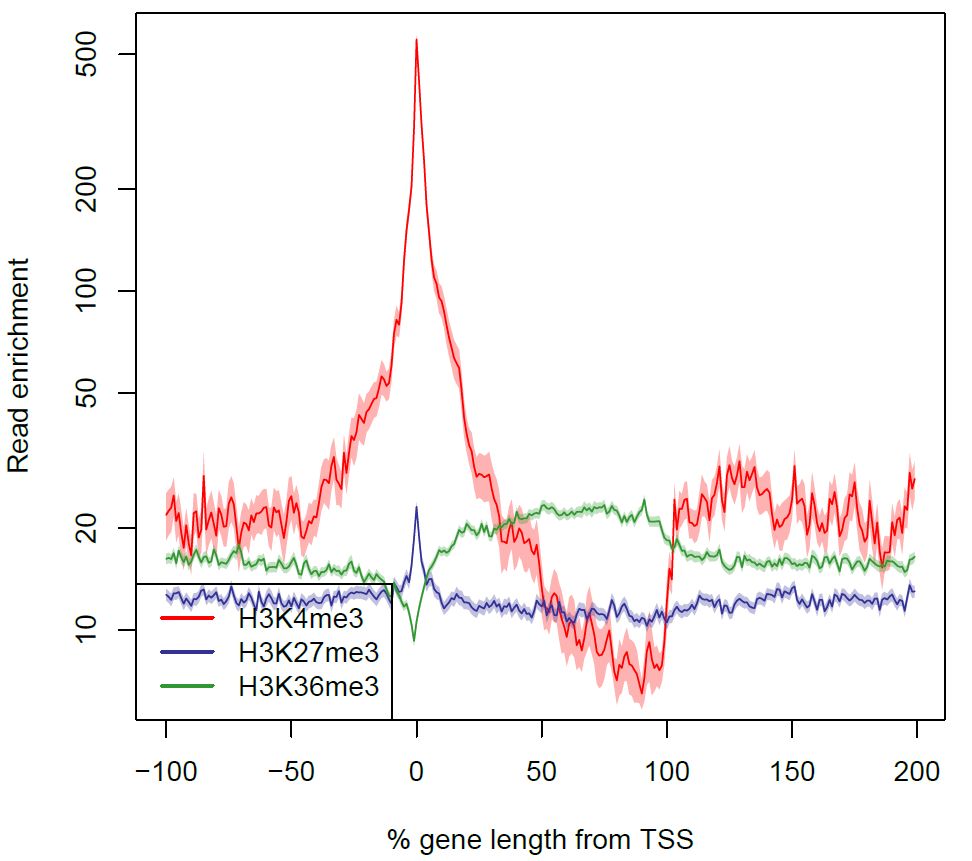
Fig. 3.24 The read enrichment as a function of the percentage of the gene length from the TSS.
3.5.2. Modify plot parameters
To modify the plot parameters (e.g., range of y-axis), change parameters descrived in the generated R script and remake the PDF file as follows:
$ R --vanilla < aroundTSS.PROFILE.averaged.ChIPread.R